Power BI: Calculating Percentages


Power BI offers extensive capabilities for calculating percentages effectively.
In the world of data analysis and business intelligence, the ability to accurately calculate and present percentages is essential. In this blog post, we dive deep into the art of percentage calculation in Power BI, from the basics to advanced techniques and applications in real-world business scenarios. Whether you are a data analyst looking to expand your skills or a business owner striving for better insights into your data, this guide will help you unlock the full potential of your data.
Introduction to Percentage Calculation
Percentage calculations are an indispensable tool in the world of data analysis and reporting. They not only serve to present data in a clear and understandable format but also allow us to visualize ratios and comparisons in a way that supports immediate insights and decision-making. In Power BI, percentage calculations are particularly valuable. They allow us to gain deeper insights into data by highlighting relative shares and changes that are crucial for understanding business trends and performance.
With Power BI's user-friendly interface and DAX (Data Analysis Expressions) functions, both simple and complex percentage calculations can be performed. These range from determining a product's share of total revenue to analyzing percentage changes over time. Visualizing this percentage data through various chart types in Power BI supports understanding and decision-making. In the next section, we will look at detailed use cases for percentage calculations in Power BI. You can find more on the basics of percentage calculation in our blog post “Power BI: Calculating Percentages”.
Detailed Examples of Calculating Percentages in Power BI
Calculating percentages is a fundamental yet powerful aspect of data analysis. It allows us to understand the size of a subset in relation to the whole and provides valuable insights into a wide range of areas – from financial analysis to market research. In this section, we focus on how to calculate percentages in Power BI to effectively analyze and visualize data. We will see how these calculations help us transform complex data sets into clear, meaningful information.
Example 1: Calculating Percentage of Revenue
Situation and objective: Imagine you are a data analyst at a company that sells multiple products. Your goal is to determine the percentage of total revenue contributed by a specific product. This information is crucial for understanding which product makes the largest contribution to the overall business.
Applying DAX functions: In Power BI, we use DAX functions to perform this calculation. Suppose you have a table named Sales with the columns ProductID, ProductName, and Revenue. To calculate the percentage of revenue for a product, you create a new measure with the following formula:
Revenue Percentage =
DIVIDE(
SUM(Sales[Revenue]),
CALCULATE(SUM(Sales[Revenue]), ALL(Sales[ProductID]))
)
This formula first sums the revenue of the selected product and then divides it by the total revenue of all products. Once you have formatted the measure as a percentage, the result is automatically multiplied by 100 and displayed as a percentage value.
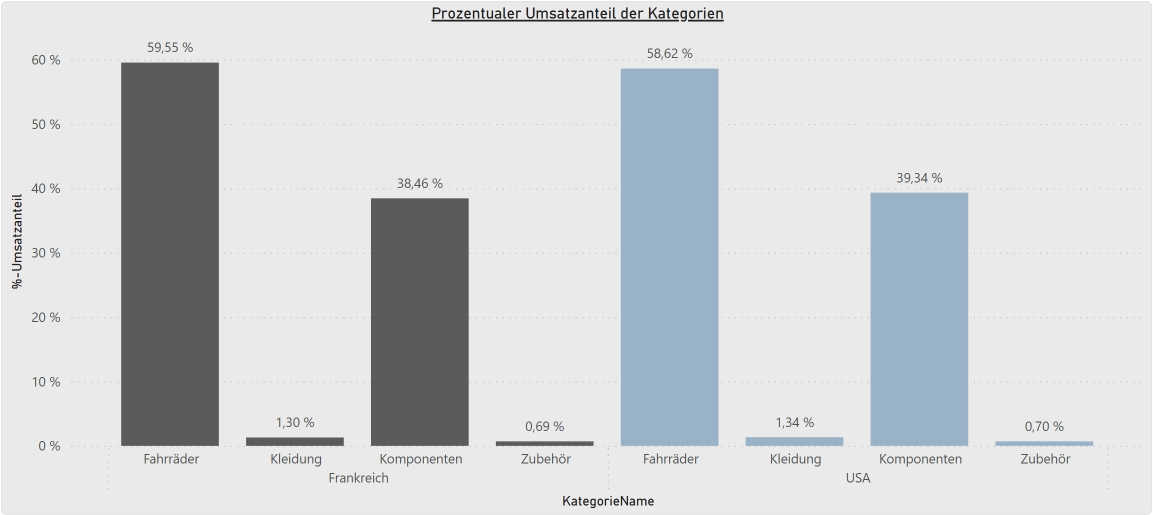
Visualization: After creating the measure, you can visualize it in a bar chart to compare the revenue percentage of each product. This provides a clear and direct representation of the revenue distribution. Note that the axis in a chart will only include a % sign if the measure is formatted as a percentage.
Example 2: Year-over-year percentage change
Situation and objective: Another key analytical tool is calculating the year-over-year percentage change in revenue. This analysis helps identify growth trends or declines and is particularly useful for strategic planning and forecasting.
Applying DAX functions: Assuming your Sales table also contains a Year column, you can create a new measure with the following formula to calculate the year-over-year percentage change in revenue:
YoY Percentage Change =
VAR CurrentYearRevenue = SUM(Sales[Revenue])
VAR PreviousYearRevenue = CALCULATE(SUM(Sales[Revenue]), DATEADD(Datum[Date], -1, Year))
RETURN
IF(
NOT (ISBLANK(PreviousYearRevenue)),
DIVIDE(CurrentYearRevenue - PreviousYearRevenue, PreviousYearRevenue),
BLANK()
)
This formula calculates the revenue for the current and previous year (based on the filter context) and then determines the percentage change between these two years.
Here is a step-by-step breakdown of the formula:
1. Defining the variables
VAR RevenueThisYear: This line defines a variable named RevenueThisYear, which calculates the total revenue for the current year, filtered by the current selections.
VAR RevenueLastYear: This line defines a second variable named RevenueLastYear, which calculates the total revenue for the year prior to the current one. Here, we use the CALCULATEfunction in combination with the Dateadd()function to determine the total revenue for the previous year.
In the DAX formula, RevenueThisYear and RevenueLastYear are used as variables to store dynamically calculated values, such as total revenue for the current and previous year. In DAX, variables act as temporary storage, allowing calculation results to be used efficiently by calculating them once and then referencing them multiple times within a formula. This not only makes the formula clearer and easier to understand, but it also adapts automatically to data changes without requiring modifications to the calculation logic itself. Storing specific calculation results in variables and reusing them improves the efficiency and clarity of longer formulas in particular.
2. Calculating and returning the percentage change
RETURN: After defining the variables, the RETURNcommand follows, which returns the result of the formula.
IF(NOT(ISBLANK(UmsatzVorjahr)), ... , BLANK()): This condition checks whether UmsatzVorjahr has a value (is not blank). If UmsatzVorjahr contains a value, the percentage change is calculated; otherwise, the formula returns a blank value (BLANK()). This prevents calculation errors when no data is available for the previous year.
(UmsatzDiesesJahr - UmsatzVorjahr) / UmsatzVorjahr: This is the actual calculation of the percentage change. It subtracts the previous year's revenue from the current year's revenue and divides the result by the previous year's revenue. By subsequently formatting it as a percentage, the value is automatically multiplied by 100, so that, for example, 0.33 is formatted as 33%.
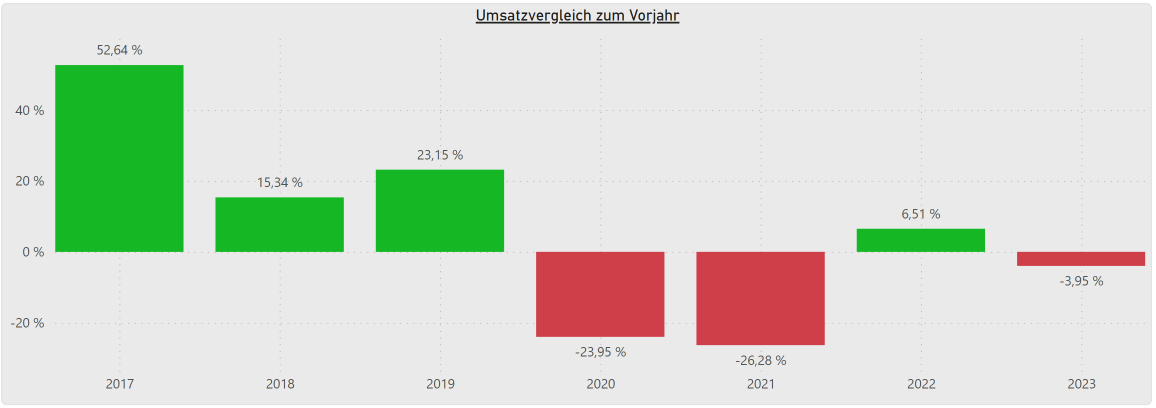
Visualization: A line chart showing the percentage change in revenue over the years is ideal for visualizing this data. This allows trends to be identified quickly and business strategies to be adjusted accordingly.
Application in various business scenarios
The ability to calculate and visualize percentages and changes in Power BI has wide-ranging applications across various business sectors. Two case studies—one in retail and one in financial services—illustrate how companies use these techniques to make data-driven decisions.
Case study 1: Retail – Analyzing the percentage share of online sales
Situation and challenge
A medium-sized retail company that operates both physical stores and an online shop is facing the challenge of evaluating the effectiveness of its online sales channel. The company wants to understand the percentage of total revenue generated by online sales in order to analyze the performance of the online shop compared to the physical stores and to develop appropriate marketing and sales strategies.
Application of Power BI
The company uses Power BI to consolidate and analyze its sales data from various channels. A key task is to calculate the percentage share of online sales in total revenue. A DAX formula is used in Power BI for this purpose:
Percentage of online sales = DIVIDE(CALCULATE(SUM (SalesData[Revenue]), SalesData[Channel] = "Online"), CALCULATE(SUM(SalesData[Revenue]), All(SalesData [Channel])), 0)
CALCULATE(SUM (SalesData[Revenue]), SalesData[Channel] = "Online")represents the revenue generated through online sales.
CALCULATE(SUM(SalesData[Revenue]), All(SalesData [Channel]))is the company's total revenue, including all sales channels.
DIVIDEperforms a safe division, where the third parameter (0 in this case) specifies the value to return if the denominator is zero.
In addition, the data is analyzed seasonally to identify trends and patterns in online purchasing behavior.
Results and strategic decisions
The analysis in Power BI provides the company with key insights:
- Identifying the share of online sales: The company can precisely determine the online shop's contribution to total revenue.
- Comparison with physical stores: By comparing the share of online sales with that of physical stores, the company can evaluate the performance of its various sales channels.
- Adjusting strategies: Based on the results, the company can adjust its marketing strategies to strengthen the online sales channel if it is underrepresented, or conversely, increase investment in physical stores if they are dominant.
- Identifying seasonal trends: Seasonal analysis helps identify key periods for targeted marketing campaigns to boost online sales.
By applying Power BI and utilizing specific DAX formulas, the retail company was able to gain valuable insights into the performance of its online sales channel and make informed decisions for a more effective sales and marketing strategy.
Case Study 2: Financial Services
Situation and challenge
A financial services company is tasked with analyzing the composition of its investment portfolio. It wants to understand how market changes affect different asset classes and products in order to manage risk and optimize returns.
Application of Power BI
The company uses Power BI to conduct in-depth analyses of its portfolio. A key aspect of this is calculating the percentage share of each asset class within the total portfolio. A DAX formula is used for this purpose:
Prozentualer Anteil Anlageklasse = DIVIDE( SUM (Portfolio[Wert]), CALCULATE(SUM(Portfolio[Wert]), All(Portfolio [Anlageklasse])), 0)
In this formula:
SUM(Portfolio[Wert])represents the value of a specific asset class.
CALCULATE(SUM(Portfolio[Wert]), All(Portfolio [Anlageklasse]))represents the total value of all assets in the portfolio. TheAll()function ensures that the calculation is performed based on all attributes in the asset class column.
DIVIDEperforms a safe division, where the third parameter (in this case, 0) specifies the value to be returned if the denominator is zero.
In addition to calculating the percentage share of each asset class, the company tracks the percentage change in asset values over time. This is complemented by the integration of external market data to evaluate the portfolio's performance in the context of market changes.
Results and strategic decisions
The analysis in Power BI leads to several key insights and decisions:
- Assessment of portfolio diversification: The company can accurately identify how its portfolio is distributed across various asset classes, which is crucial for risk management.
- Identification of market changes: By tracking the percentage changes in asset values over time and comparing them with market data, the company can better understand how external factors influence its portfolio.
- Strategic reallocation: Based on the insights gained, the company makes decisions regarding the reallocation of assets to minimize risk and maximize returns. This may include, for example, shifting funds from more volatile to more stable asset classes.
- Adaptation to market conditions: The company can dynamically adjust its investment strategy to respond to market changes and capitalize on opportunities.
By using Power BI and the targeted application of DAX formulas, the financial services company was able to gain a deep understanding of the composition and performance of its portfolio. These data-driven insights enabled the company to make informed strategic decisions that contribute to risk minimization and return maximization.