Power BI: Calculate New Column


Understanding Calculated Columns in DAX
Power BI allows users to analyze complex data in a simple and effective way. A key aspect of this is the ability to create and use calculated columns. In this blog post, we will explain the difference between calculated columns and measures in Power BI, provide a guide on how to create and use calculated columns, showcase practical examples and use cases, and discuss the performance implications of using calculated columns.
Difference between calculated columns and measures
Calculated columns and measures are two central, yet often confused, concepts in Power BI that are crucial for data analysis and visualization. To fully understand their use and significance, it is important to know their differences and areas of application.
Calculated columns
Calculated columns in Power BI are created using DAX (Data Analysis Expressions) and are similar to standard columns in your data source, but they differ in that their values are based on a formula or expression that references other columns, usually within the same table. These columns are created directly at the data modeling level and are an integral part of the data model. Once calculated, the values are stored in every row of the dataset and do not change unless the underlying data or the formula itself is modified.
A key advantage of calculated columns is that they allow you to perform transformations and calculations before the data is used for analysis and reporting. This can be particularly useful for normalizing data, creating categories, or performing complex calculations that can then be used in visualizations or as part of filters.
In addition to calculated columns in DAX, Power BI also offers the ability to create and edit columns in the Power Query Editor. The Power Query Editor uses the formula language M (also known as M-Query), which offers a different approach to data manipulation. While DAX is primarily used for data analysis and calculation within the data model, M is ideal for data preparation and transformation before the data is loaded into the model. With M, users can import, filter, sort, group, and transform data. This provides a flexible and powerful way to clean and prepare data before it is used for further analysis and calculations in DAX.
Measures
Measures, on the other hand, are dynamic calculations performed in Power BI at the time of the query. They are often used to calculate aggregated data such as sums, averages, minimums, maximums, or counts. Unlike calculated columns, which are stored in the data source, measures are calculated in real-time based on the current filters and contexts applied in a report or analysis.
A major advantage of measures is their flexibility and efficiency, especially with large datasets. Since they are only calculated when needed, they can improve performance while offering high adaptability to different analytical contexts. Measures are ideal for scenarios where users interact with data, such as drilling down into reports or applying various filters.
In summary, calculated columns in Power BI are best suited for static calculations that should become part of the data model, while measures are used for dynamic, context-dependent calculations based on aggregated data. The choice between calculated columns and measures depends on the specific requirements of your data analysis and the performance considerations of your Power BI model, as calculated columns increase the size of the data model significantly more than measures.
Guide to creating and using calculated columns
Creating and using calculated columns in Power BI is an essential part of data modeling and analysis. These columns allow you to expand and customize your data in a variety of ways. Here is a detailed guide on how to create and effectively use calculated columns in Power BI:
Creating a calculated column:
- Open the data model: Start by opening your data model in Power BI Desktop.
- Switch to Table view : Select the table view on the left side.
- Select the desired table: Under the ‘Data’tab on the right, select your table.
- Add a new column: Once you have selected your desired table, click either at the top, in Table tools on ‘New column’ or right-click your desired table and select ‘New column’.
- Use a DAX formula: Calculated columns are created using DAX (Data Analysis Expressions) .
- Enter the formula: Type your DAX formula into the formula bar. For example, to create a column that calculates the total price from quantity and unit price, you can use a formula like
Total Price = [Quantity] * [Unit Price]. - Verify and save the formula: After entering your formula, check it for errors and then save it. The new calculated column will be added to your table.

Using calculated columns
Calculated columns in Power BI can be used for a variety of purposes:
- Reformatting data: You can use calculated columns to display data in a more user-friendly format, such as combining first and last names into a single column.
- Creating new values: Calculated columns are ideal for creating new values based on existing data, such as calculating profit margins or converting currencies.
- Merging data: You can combine data from different sources or columns into a single calculated column to enable more comprehensive analysis.
- Conditional logic: Calculated columns can be used to perform conditional calculations, such as categorizing data based on specific criteria.
Best practices
- Optimizing formulas: Ensure your DAX formulas are efficient so they don't negatively impact the performance of your Power BI model.
- Avoiding redundant calculations: Do not create calculated columns that can already be covered by existing data or measures.
- Clear naming: Give your calculated columns clear and descriptive names to improve the readability and maintainability of your model.
By following these steps and best practices, you can fully leverage the functionality of Power BI and take your data analysis to the next level.
Practical examples and use cases for calculated columns in Power BI
Calculated columns in Power BI are extremely versatile and can be used in a variety of scenarios. Here are some practical examples and use cases that demonstrate the usefulness of calculated columns in the real world:
Categorization and segmentation:
Customer segmentation: Create a calculated column to categorize customers into different segments based on their purchasing behavior or other criteria.
Table: Customers

Calculated column: Customer segment
Formula: Customer segment = IF([Total Revenue] > 10000, "VIP", "Standard")Result:

Calculating metrics:
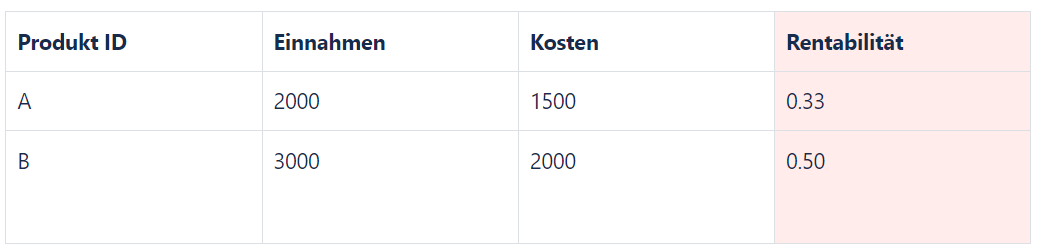
Profitability analysis: Calculate the profitability of products or services.
Table: Products

Calculated column: Profitability
Formula: Profitability = ([Revenue] - [Costs]) / [Costs]Result:
Time- and event-based analysis:
Seasonal trends: Identify seasonal trends in your data by analyzing sales figures by month or quarter.
Table: Monthly sales

Calculated column: Seasonal trend
Formula: Seasonal trend = [Sales figure] - AVERAGE(MonthlySales[Sales figure])Result:

These examples illustrate how calculated columns can be used in Power BI to gain additional insights from existing data. They demonstrate the flexibility of Power BI in processing and analyzing data for a wide range of business requirements.
Performance considerations for calculated columns in Power BI
Using calculated columns in Power BI can have a significant impact on the performance of your data models and reports. It is important to understand the performance implications and apply best practices to ensure optimal performance.
Storage consumption:
Memory-intensive: Using calculated columns increases the size of the data model and requires more memory. This is particularly relevant for large datasets.
Data types: The data type of a calculated column can affect memory usage. For example, text columns consume more memory than numeric columns.
Calculation time:
Calculation during refresh: Calculated columns are recalculated every time data is refreshed. Complex or extensive calculations can increase refresh times. Dependencies: Performance can also be affected by the number of dependencies. If a calculated column is based on other calculated columns, this can lead to a chain reaction of recalculations.
Optimization tips:
Avoid unnecessary calculations: Only create calculated columns when absolutely necessary. Often, similar results can be achieved using measures or by processing data before importing it.
Efficient DAX formulas: Use efficient DAX formulas. Avoid unnecessary calculations and use DAX functions that are optimized for performance.
Filtering and aggregation: Filter data before creating calculated columns and use aggregations to reduce the volume of data.
Monitoring and analysis:
Performance Analyzer: Use the Performance Analyzer in Power BI to monitor report execution times and identify which elements take the most time.
Data model review: Regularly check your data model for inefficient calculations and optimize it accordingly.

Best practices for design and maintenance:
Data model design: Plan your data model carefully. A well-structured model can reduce the need for calculated columns.
Maintenance and revision: Regularly review your calculated columns and remove any that are no longer needed to improve performance.
Considering these performance aspects is crucial to ensuring that your Power BI reports function smoothly and efficiently. By applying these best practices, you can fully leverage the power of Power BI without compromising on speed or user experience.