Power BI DAX: COUNTIF


Mastering Power BI DAX: Conditional Counting – Your Guide
Are you ready to take your Power BI skills to the next level? It’s time to get familiar with one of the most powerful techniques in DAX: conditional counting, a method similar to the COUNTIF function in Excel. This technique is not only a key tool for data analysts but also an indispensable asset for examining complex datasets efficiently and effectively.
Introduction to Conditional Counting with DAX in Power BI
Welcome to the dynamic world of Power BI and DAX (Data Analysis Expressions), where data analysis and visualization are taken to a new level. A key element in this process is applying conditional counting logic, similar to the COUNTIF function in Excel, but implemented through the powerful functions of DAX. This technique is crucial for determining the number of records that meet specific criteria—a common yet complex requirement in data analysis.
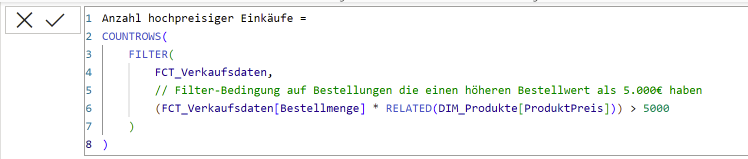
Power BI doesn't have a direct COUNTIF function, but you can achieve similar results using DAX. This is done by combining functions like CALCULATE, COUNTROWS, and FILTER to count the number of rows in a table that meet a defined condition. Imagine you have a table of sales data and want to know how many sales exceed a certain amount, or you have a customer list and want to determine how many customers are from a specific region. With conditional counting in DAX, you can perform such specific queries efficiently.
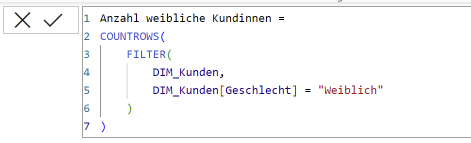
The real advantage of this technique in DAX lies in its flexibility and power. Unlike simple counting functions you might know from Excel, conditional counting in DAX allows for much more precise, condition-based analysis. You can define complex criteria that take into account multiple columns or even different tables within your data model. This ability to dive deep into data and identify specific patterns or trends makes this technique an essential component for anyone working seriously with Power BI.
In this section, we will take an in-depth look at conditional counting in DAX, understand how it works, and explore how it can elevate your data analysis in Power BI. Whether you are just starting out or already have experience with Power BI, a solid understanding of this technique will help you use your data more effectively and gain deeper insights.
Comparison with Excel Functions
For those of you already familiar with Excel, comparing conditional counting in DAX with the COUNTIF function in Excel offers interesting insights. At first glance, it may seem that both methods pursue similar goals—counting data points that meet specific criteria. However, a closer look reveals significant differences in how they function and are applied, primarily due to the different environments of Excel and Power BI.
In Excel, the COUNTIF function is based on cell references. You define a range of cells and a criterion, and Excel counts the number of cells in that range that meet the criterion. This function is very useful for simple and direct queries, but it reaches its limits when it comes to more complex data relationships and analyses.
DAX in Power BI, on the other hand, takes things a step further. Instead of a direct COUNTIF function, DAX uses a combination of CALCULATE, COUNTROWS and FILTERto achieve similar results. This approach allows for the creation of much more complex and dynamic queries. For example, you can define conditions that relate to multiple tables or depend on other measures within the data model. This opens up a world of possibilities for in-depth data analysis, especially with large and complex datasets.
Another key difference is how DAX performs calculations. While Excel calculates each cell individually, DAX uses a more powerful and efficient calculation engine specifically designed for large volumes of data and complex queries. This means that DAX analyses are generally faster and more efficient, particularly when dealing with extensive datasets.
In summary, while conditional counting logic in DAX and COUNTIF in Excel share similar basic functions, DAX offers a more extensive and powerful solution for data analysis in a business intelligence context. The ability to navigate complex data relationships and work efficiently with large datasets makes DAX an indispensable tool for any Power BI user.
Use Cases and Case Studies
The applications for conditional counting logic in DAX are diverse and can provide valuable insights across various business areas. Here are some concrete examples illustrating how this technique is applied in real-world scenarios:
Sales Analysis
Scenario: Suppose you want to analyze how many sales in the "North" region exceeded an amount of 10,000 euros.
Example table: Sales
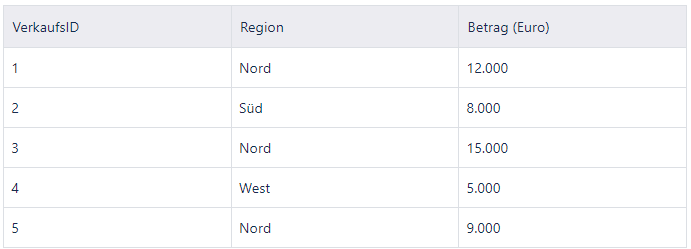
In this scenario, sales with IDs 1 and 3 would be counted, as they are in the "North" region and have an amount over 10,000 euros.
DAX formula:
SALES_NORTH_OVER_10000 =This formula filters the Sales table to count only the rows that are in the "North" region and have an amount over 10,000 euros.
COUNTROWS(
FILTER(
'Sales',
'Sales'[Region] = "North" && 'Sales'[Amount] > 10000
)
)
Customer feedback
Scenario: You want to know how many customers gave positive feedback (rating 4 or 5) for product "X".
Example table: Customer feedback
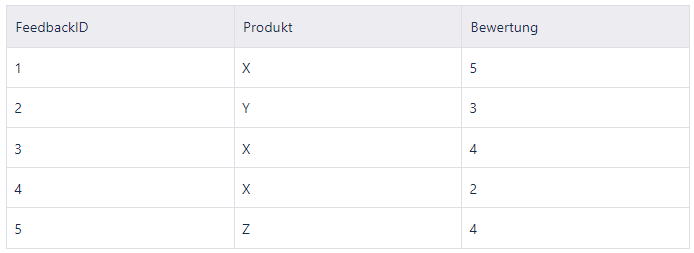
In this case, the feedback entries with IDs 1 and 3 would be counted, as they relate to product "X" and have a rating of 4 or higher.
DAX formula:
POSITIVE_FEEDBACK_X =
COUNTROWS(
FILTER(
'CustomerFeedback',
'CustomerFeedback'[Product] = "X" && 'CustomerFeedback'[Rating] >= 4
)
)
This formula counts the number of feedback entries for product "X" that have a rating of 4 or higher.
Inventory management
Scenario: Determine how many products in inventory are below a critical level of 50 units.
Example table: Inventory
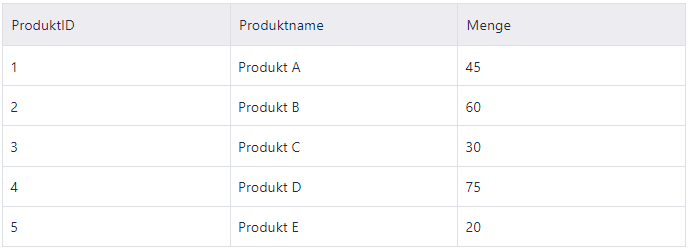
In this scenario, products with IDs 1, 3, and 5 would be counted because their quantity is below the critical level of 50 units.
DAX formula:
CRITICAL_STOCK =
COUNTROWS(
FILTER(
'Inventory',
'Inventory'[Quantity] < 50
)
)
This formula helps to quickly identify products whose stock levels have fallen below the critical threshold, which is essential for inventory planning and reordering.
Tips for improving performance with large datasets
Working with large datasets in Power BI can be challenging, especially when it comes to executing DAX queries for conditional counts efficiently. Here are some advanced tips to help you optimize the performance of your DAX queries:
- Avoid unnecessary calculations
- Efficient conditions: Limit the number of conditions in your DAX formulas. Each additional condition can increase execution time, especially with large datasets.
- Avoiding complex calculations: Complex calculations within your DAX queries can impact performance. Try performing calculations outside the main query and using the results as filter criteria.
- Use filters wisely
- Pre-filtering: Instead of scanning the entire dataset, use filters to reduce the data volume before applying complex calculations. This can be achieved by using filter functions like FILTER().
- Pre-filtering: Instead of scanning the entire dataset, use filters to reduce the data volume before applying complex calculations. This can be achieved by using filter functions like FILTER().
- Optimize your data model
- Efficient data structure: Ensure your data model is well-structured. Avoid unnecessary relationships and columns that can hinder performance.
- Star schema design: Whenever possible, use a modeling technique preferred by BI tools, such as a star schema, for your data model. This design separates transactional data (fact tables) from descriptive data (dimension tables), which can improve query performance.
By following these advanced tips, you can significantly boost the performance of your conditional counts in Power BI, even when working with large datasets. This leads not only to faster query times but also to more efficient resource usage and an improved user experience.