Power BI: Calculating duration


Efficient Time Difference Calculation in Power BI: A Key to Success in Data Analysis
The ability to precisely calculate and analyze duration is essential in today's data-driven business world. Microsoft Power BI offers extensive features to master this task. We will show you how to master calculating the difference between two dates in Power BI. To do this, we will examine various methods, the application of DATEDIFF and other relevant time functions, illustrate this with concrete case studies, and provide practical tips for visualizing durations in reports.
Different Methods for Calculating Time Differences in Power BI
In Power BI, there are several practical ways to calculate time differences that can be adapted to your specific needs. A commonly used approach is the DATEDIFF function. This function is particularly helpful when you want to determine the time difference between two dates, whether in days, hours, or minutes. For example, you can easily find out how many days lie between the order date and the delivery date.
In addition to DATEDIFF, there are other useful time functions such as DATEADD and TotalYTD. DATEADD is ideal for shifting a specific date by a set number of days, months, or years. This is particularly practical for calculating the expected delivery date by adding a time span to the order date. TotalYTD, on the other hand, is very helpful for determining the cumulative total performance of a company from the beginning of the year to a specific date, which can be of great importance for annual planning and performance analysis.
In some cases, however, a single function is not enough to achieve the desired results. This is where combining different functions comes into play. For example, you could first modify the delivery date with the DATEADD function and then use the DATEDIFF function to calculate the delivery time, i.e., the time span between the order date and the delivery.
Another essential element in time difference calculation for business applications is accounting for weekends and holidays. In Power BI, these can be factored in through a combination of different functions and custom logic. Furthermore, Power BI allows for the creation of individual formulas that differ from standard 9-to-5 working hours and enables the implementation of dynamic calculations that automatically adjust to changing data.
Through these various methods and functions in Power BI, you can precisely calculate the time differences you need for your data analysis.
Application of DATEDIFF and Other Power BI Time Functions
Calculating time intervals precisely is a key part of data analysis in Power BI. The DATEDIFF function plays a central role here, but other time functions also offer valuable capabilities. You can find a detailed guide on calculating the number of days between two dates using the DATEDIFF function in this article.
For even more precise time calculations in Power BI, you can also use other time functions such as DATESYTD, DATEADD, and TOTALYTD. These functions expand your options for working with time-based data and allow you to perform a wide range of time-related analyses.
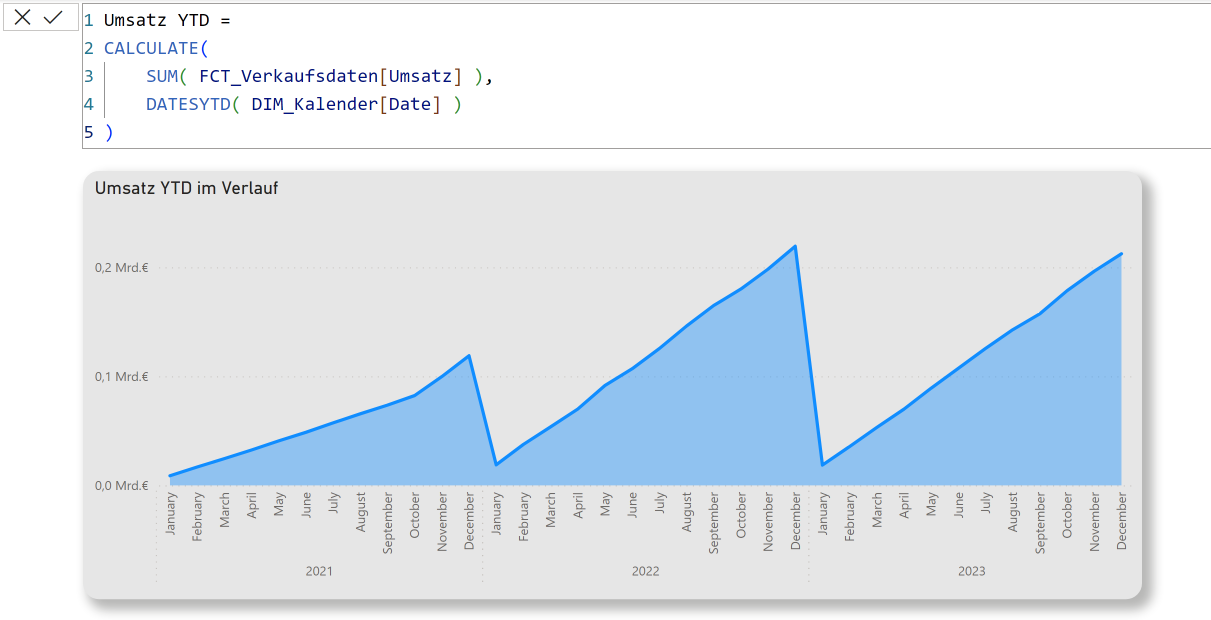
DATESYTD is a function that allows you to capture all data from the beginning of the year up to a specific date. This is particularly useful for year-over-year comparisons or analyzing performance over a specific period. The syntax is: DATESYTD(date_column), where date_column is the column containing the dates.
Example: DATESYTD('Sales[Date]') would return all sales data from the beginning of the year to the current date in the current context within the 'Sales[Date]' column.
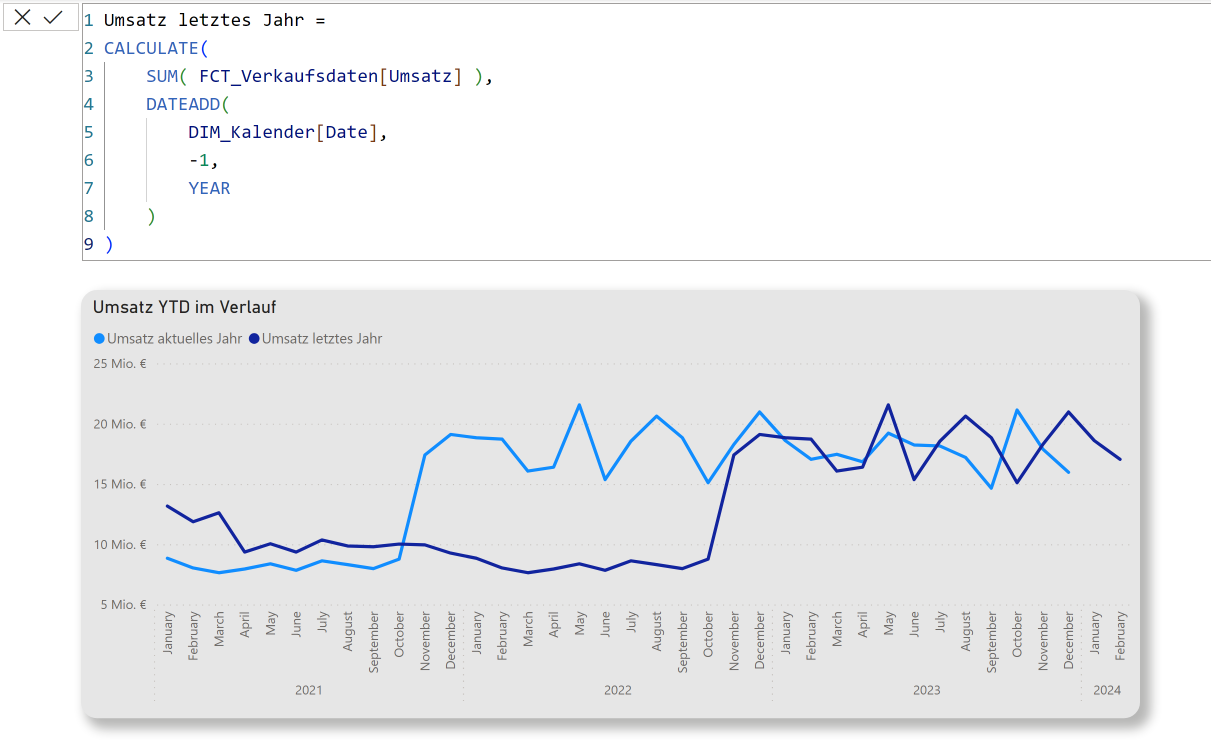
DATEADD adds a specified number of time intervals to a date. The general syntax is: DATEADD(date, number_of_intervals, interval_type).
Example: DATEADD("2023-01-01", 3, "month") adds three months to January 1, 2023, resulting in April 1, 2023.
TOTALYTD calculates the cumulative sum of a value from the beginning of the year to the current date in the current context. This is especially useful for analyzing annual performance across different business areas. The syntax is: TOTALYTD(expression, dates), where expression of the values to be summed and dates is the date.
Example: TotalYTD(SUM('Sales[Amount]'), 'Sales[Date]') would calculate the running total of sales amounts from the beginning of the year to the current date in the 'Sales[Date]' column.
In addition to these, there are other functions that can be used to calculate time durations. Here are some additional functions that may be useful:
TIMEVALUE:
This function converts a time in text format into a serial number format that Power BI uses for time calculations.
Example: TIMEVALUE("6:30 PM") converts the text time "6:30 PM" into a serial time format.
NETWORKDAYS:
This function calculates the number of working days between two dates, excluding weekends (Saturday and Sunday) and optional specified holidays.
Example: NETWORKDAYS(start_date, end_date, holidays) returns the number of working days between two dates, where holidays is a list of holiday dates.
NOW and TODAY:
NOW returns the current date and time, while TODAY returns only the current date. These functions are useful for including the current time or date in calculations.
These functions can be used in various combinations to perform a wide range of time calculations, from simple difference calculations to complex business logic that accounts for working days and holidays. Their application depends on the specific requirements of your data analysis and the features available in your specific data analysis tool.
Case Studies: Practical Applications of Time Difference Calculation in Power BI
Calculating time differences in Power BI is used in a variety of business scenarios. We present two detailed case studies that illustrate the versatility and importance of these calculations in the real world.
1. Case Study: Optimizing Processing Times in a Customer Service Center
Background: In a customer service center, the fast and efficient processing of customer inquiries is crucial for customer satisfaction. It is important to measure and optimize the average processing time.
Data Collection: Power BI is used to track data such as when a customer inquiry is received, when processing begins, and when the inquiry is resolved.
Analysis: By applying time functions like DATEDIFF, processing times for each inquiry can be calculated. This data can then be aggregated to identify averages, peak times, and trends, for example.
Results and actions: The analysis can reveal the times of day when processing times are longest or which types of inquiries take more time. Targeted measures such as staff scheduling or process optimization can then be initiated.
2. Case study: Analyzing delivery times in the logistics industry
Background: In the logistics industry, accurate and efficient delivery times are crucial for customer satisfaction and operational efficiency. Monitoring and analyzing these times is therefore of great importance.
Data collection: For every shipment, the shipping date, the estimated delivery date, and the actual delivery date are recorded.
Analysis: Power BI is used to compare planned and actual delivery times by using functions like DATEDIFF to identify discrepancies and delays.
Results and actions: The analysis can uncover patterns in delivery delays, such as specific routes or timeframes with frequent lateness. This allows the company to review and adjust logistics processes to increase efficiency and improve customer satisfaction.
Visualization tips for time differences in Power BI reports:
Effectively visualizing time differences in Power BI reports is a key element in making complex data accessible and actionable. Here are some advanced tips for optimally displaying durations in your reports:
Choosing the right chart type:
- Bar charts: Ideal for displaying durations of different categories or groups side-by-side. They allow for a quick comparison of duration between different elements.
- Line charts: Perfect for showing trends over time. They are particularly useful for tracking the development of processing or delivery times over a longer period.
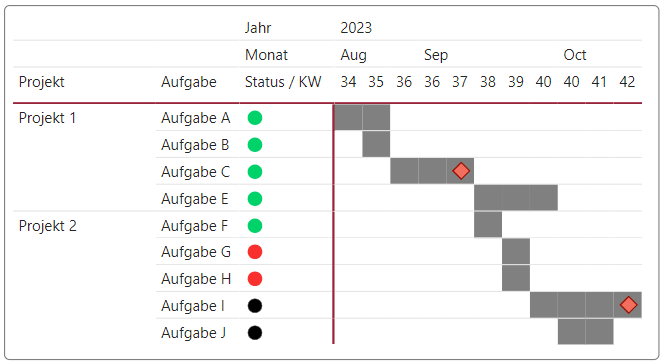
- Gantt charts: These are especially effective for displaying projects or tasks and their respective durations within the context of a schedule. They help visualize overlaps and dependencies between tasks.
Calculating and visualizing time differences in Power BI is a powerful tool for companies to gain insights into their processes and make informed decisions. By mastering the various functions and techniques, companies can increase their efficiency and gain a competitive advantage.