Power BI: Calculating time periods


Power BI Expert Tips: Calculating Time Periods More Intelligently
Accuracy in calculating time periods plays a central role in advanced data analysis. This post explores advanced techniques for time period calculation in Power BI, with a special focus on using DAX functions. We will look at how to define specific time periods like quarters and fiscal years, use time intelligence functions for comprehensive analysis, and highlight methods for efficiently creating periodic reports. Furthermore, we offer practical tips for implementing dynamic time period calculations in your reports. Get ready to deepen your Power BI knowledge and sharpen your data analysis skills.
Calculating specific time periods (e.g., quarters, fiscal years):
In the world of business intelligence, the ability to calculate specific time periods accurately is essential. Power BI, with its robust DAX (Data Analysis Expressions) language, gives you the flexibility to perform complex time period calculations with ease. Whether you need to analyze quarters, fiscal years, or other custom timeframes, Power BI has the tools you need.
Let's start with calculating quarters. In many business scenarios, it is important to measure and compare performance on a quarterly basis. With the DAX function TOTALQTD you can quickly calculate the period from the start of a quarter up to a specific date. This function is particularly useful for creating quarterly reports or comparing quarterly performance.
Example: Suppose you want to analyze the total sales for a quarter. You can use the TOTALQTD function to calculate sales figures from the beginning of the quarter to the current date. For example:
Quartalsverkäufe = TOTALQTD(SUM(Verkaufstabelle[Verkaufsbetrag]), 'Kalendertabelle'[Datum])
This formula sums the sales amounts from the beginning of the quarter to the current date in the calendar table.
For analyzing fiscal years that do not necessarily begin on January 1st, the TOTALYTDfunction is a valuable tool. This function allows you to calculate cumulative totals up to a specific date within the fiscal year. It is ideal for annual reports or for comparing performance across different fiscal years.
Example: If your fiscal year begins in April and you want to calculate cumulative sales up to the current date in the fiscal year, you can use TOTALYTD . For example:
FiscalYearSales = TOTALYTD(SUM(SalesTable[SalesAmount]), 'CalendarTable'[Date], "04/30")
This formula calculates total sales from May 1st to the current date. The "04/30" addition in the formula instructs Power BI to treat the fiscal year as running from May 1st of the current year to April 30th of the following year. This is particularly important because Power BI defaults to January 1st through December 31st for cumulative calculations. By specifying an alternative fiscal year end date, this formula enables accurate cumulative calculations tailored to your company's specific fiscal calendar. This approach can be crucial for financial reporting and analysis.
Another important tool in your arsenal is DATESYTD. This function helps you calculate the period from the beginning of the year up to a specific date. It is especially useful for performing year-over-year comparisons and identifying trends over longer periods.
Example: To compare this year's sales figures with those of the previous year, you can DATESYTD use. For example:
Current Year Sales = CALCULATE(SUM(FCT_SalesData[Revenue]), DATESYTD(DATEADD('DateTable'[Date], -1, YEAR)))
These formulas calculate sales figures for the current year and the previous year up to today's date.
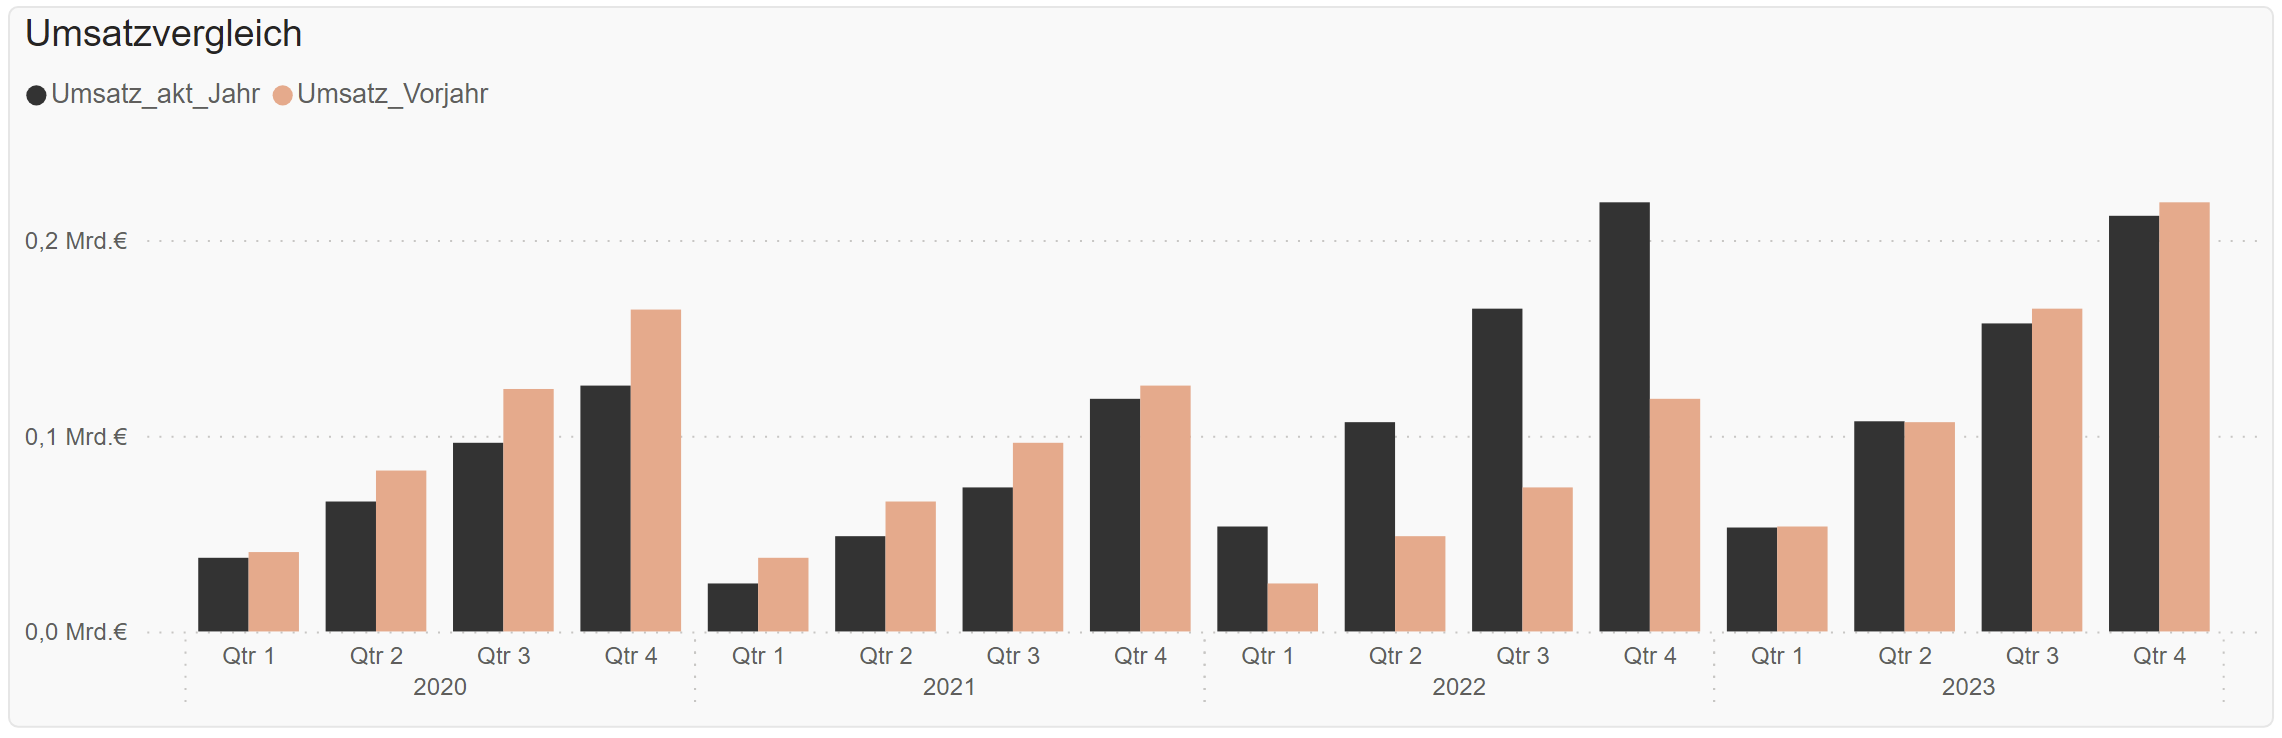
These functions are just the tip of the iceberg. Power BI allows you to further customize these functions to suit your specific business needs. For example, you can add filters to include only certain data sets in your calculations or create complex formulas that combine multiple time intelligence functions to gain deeper insights into your data.
By mastering these powerful DAX functions, you can create tailored time periods for your data analysis, helping you make better business decisions and turn your data into meaningful insights.
Using Time Intelligence Functions in Power BI
Time intelligence functions in Power BI are essential for conducting in-depth analysis and comparisons across different time periods. These functions allow you to analyze historical data, identify trends, and make predictions for the future. Two of the most powerful tools in this area are SAMEPERIODLASTYEAR and DATEADD.
Analysis with SAMEPERIODLASTYEAR: The SAMEPERIODLASTYEAR function is ideal for evaluating your company's performance compared to the previous year. It allows you to retrieve data from the same period of the prior year, which is essential for year-over-year comparisons. For example, you can compare this year's revenue with last year's to assess growth or decline. A typical application might look like this:
Previous Year Revenue = CALCULATE(SUM(SalesTable[Revenue]), SAMEPERIODLASTYEAR('CalendarTable'[Date]))
This formula helps you identify patterns and trends in your business year over year and react accordingly.
Time shifts with DATEADD: DATEADD is another powerful function that allows you to analyze data within a shifted timeframe. For instance, you can use it to compare today's revenue with the previous day's. This type of analysis is particularly useful for identifying short-term trends or seasonal fluctuations. The formula for this might look like this:
Previous_Day_Revenue = Calculate(Sum(SALESTABLE[Revenue]),
Dateadd(DateTable[DATE], -1, DAY))
With this analysis, you can evaluate current sales trends in comparison to an earlier period.
Using these time intelligence functions in Power BI allows you to perform complex time-based analyses that are essential for strategic business decisions. They provide the flexibility and depth needed not only to understand what is happening in your company, but also why it is happening and how you can respond to it.
Examples of periodic reports and analyses in Power BI:
Periodic reports and analyses are the backbone of data-driven decision-making in companies. Power BI allows you to not only create these reports but also automate them, ensuring you receive regularly updated insights. Here, we look at some key examples of how you can effectively implement periodic reports in Power BI:
Monthly sales reports: Monthly sales reports are crucial for monitoring your sales team's performance and identifying revenue trends. In Power BI, you can automate such reports by using DAX functions like TOTALMTD (Total Month-To-Date) to calculate cumulative sales figures for the current month. You can also integrate visual comparisons between current sales figures and targets or figures from the previous year. An example of such a calculation would be:
Monthly Sales = TOTALMTD(SUM(SalesTable[SalesAmount]), 'CalendarTable'[Date])
With reports like these, you can quickly make adjustments to your sales strategy based on the latest data.
Annual financial analyses: Annual financial analyses are indispensable for long-term planning and evaluating company performance. Power BI allows you to create annual reports that include key financial metrics such as annual revenue, costs, and profit margins. By using functions like TOTALYTD you can efficiently calculate and visualize these metrics. For example:
Annual Revenue = TOTALYTD(SUM(FinancialTable[Revenue]), 'CalendarTable'[Date])
This type of analysis provides a comprehensive overview of your company's financial health and supports strategic decision-making.
Quarterly customer retention reports: Analyzing customer retention is crucial for evaluating the effectiveness of marketing strategies and loyalty programs. With Power BI, you can create quarterly reports that highlight retention rates, average customer value, and repurchase rates. DAX functions like CALCULATE and FILTER allow you to analyze specific customer segments and identify trends over time. An example of such a calculation could be:
Quarterly Retention Rate = CALCULATE(SUM(CustomerTable[RepurchaseRate]), DATESQTD('CalendarTable'[Date]))
Tips for dynamic time period calculations in Power BI:
Dynamic time period calculations in Power BI allow you to create reports that automatically adjust to changing timeframes. This is particularly useful for ad-hoc analysis and regular updates where flexibility and adaptability are key. Here are some advanced tips for using these types of calculations effectively in Power BI:
- Using relative date filters: Power BI allows you to use relative date filters in your reports. These filters enable you to create reports that automatically refer to the current day, week, month, or any other relative date. For example, you can create a report that always displays data from the last 7 days without needing to update the date manually.
- Using time intelligence functions for dynamic calculations: Functions such as
DATEADDandDATESBETWEENcan be used to define dynamic time ranges in your formulas. For example, you can create a DAX formula that analyzes sales from the last 30 days compared to the same period in the previous year. This type of dynamic calculation is particularly valuable for identifying seasonal fluctuations or growth trends.
- Creating time filters for interactive reports: Another powerful feature in Power BI is the creation of time filters, which allow end users to interactively select the time period for the report display. You can set up filters for years, quarters, months, or even specific date ranges. This significantly increases the user interaction and flexibility of your reports.
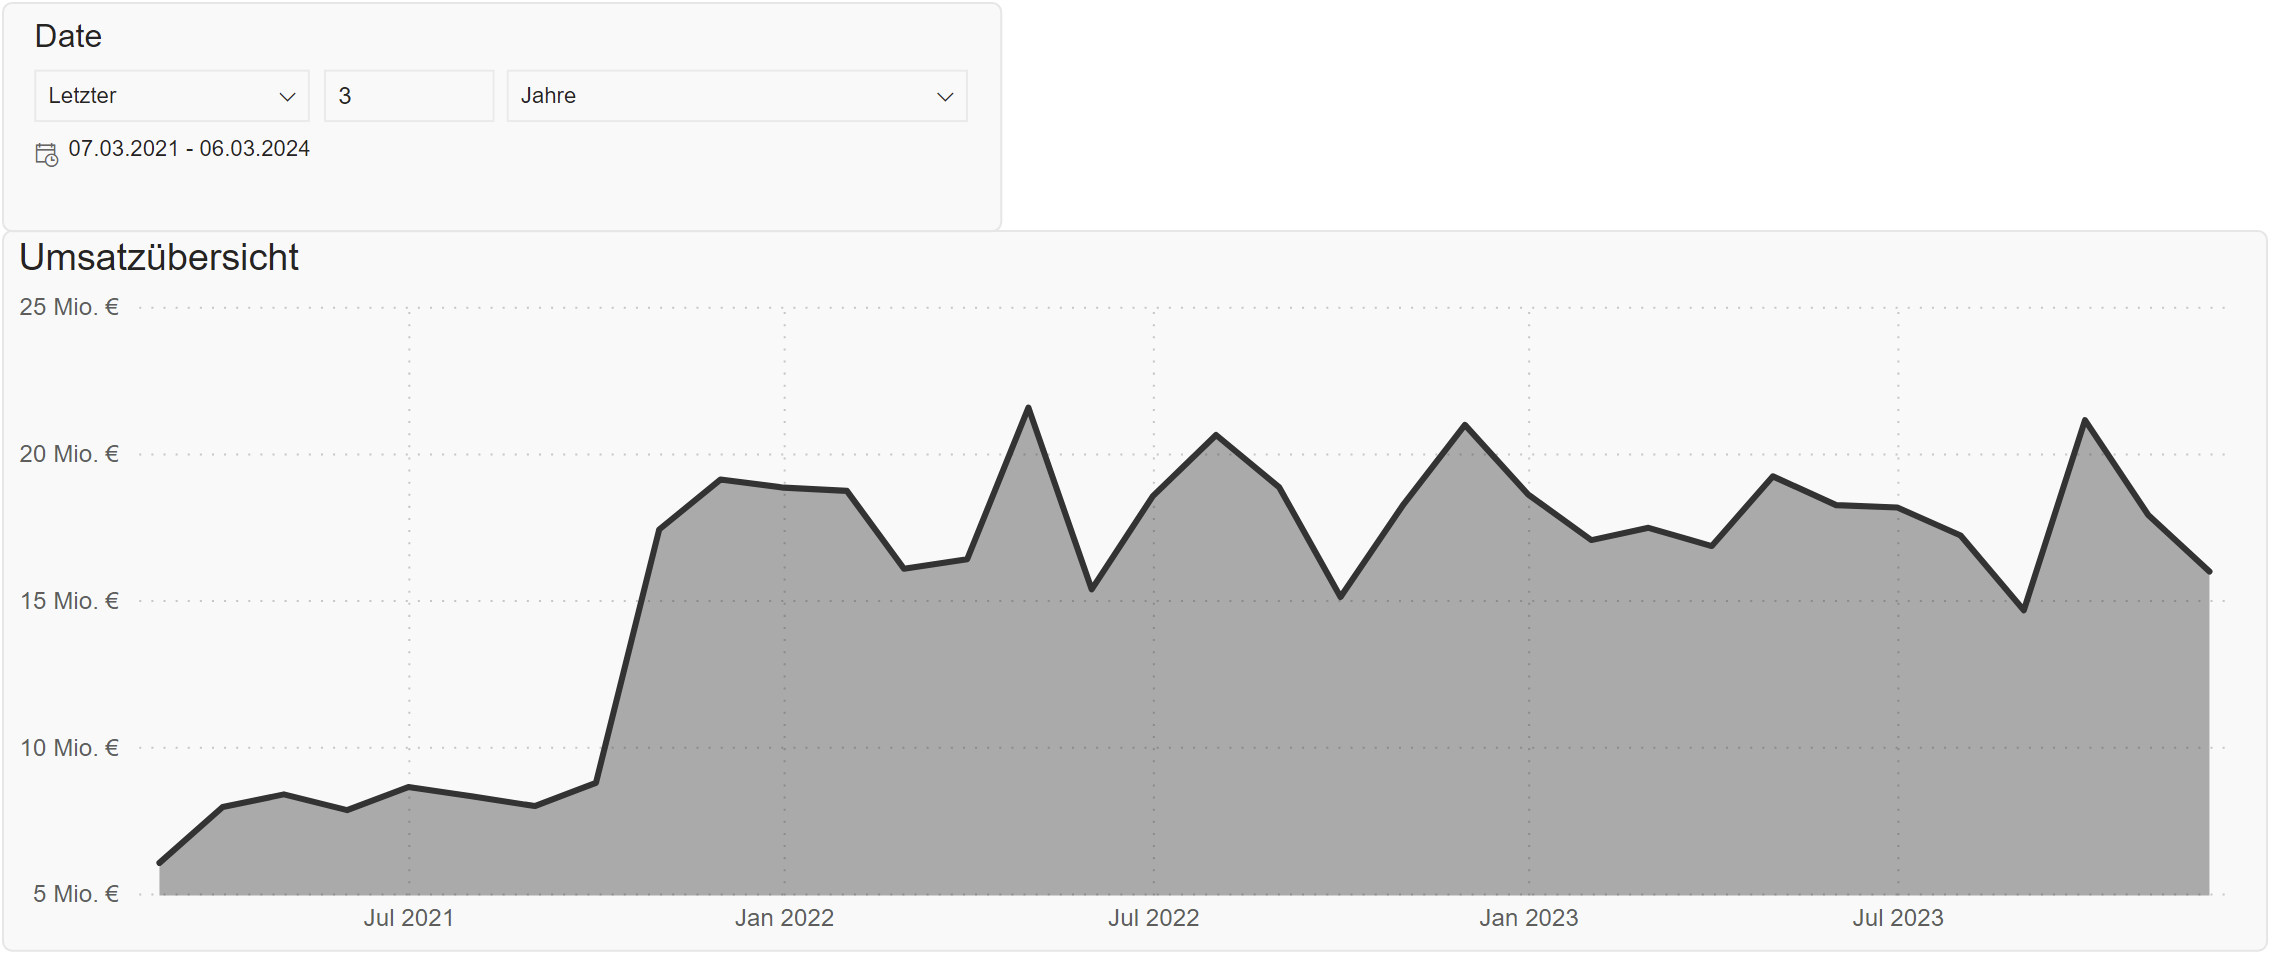
- Using parameters for flexible timeframes: In Power BI, you can define parameters that allow you to set flexible timeframes in your reports. For instance, you can create a parameter that lets the user select a start and end date for the report display. This is especially useful for ad-hoc analyses where users want to examine specific time periods.
- Automation with Power Query: For advanced users, Power Query in Power BI offers the ability to transform and filter data sources to enable dynamic time period calculations. For example, you can transform data to automatically display the last available month or a rolling date window.
By applying these advanced techniques, you can create dynamic and flexible reports in Power BI that automatically adapt to changing timeframes. This capability is crucial for gaining timely and relevant insights into your data and taking your analytical skills to the next level. With the knowledge and skills you now have at your fingertips, you are well on your way to becoming a Power BI time-period calculation expert. The techniques and tips presented are not only a stepping stone for advanced data analysis but also a guide to deepening and refining your analytical abilities. Use these insights to make your reports more dynamic and impactful. We wish you much success and enjoyment in your future analyses with Power BI.