Tutorial: Power Apps in Power BI


It just makes your life incredibly easy
The focus topic for November's BI & Breakfast is Power Apps in Power BI. With his usual expertise, Leon Potthoff introduces the approximately 50 participants to the world of Power Apps as a component of the Microsoft Power Platform. Using a practical example, it quickly becomes clear: Power Apps not only optimizes reports through automation, but also provides an incredible boost to productivity simply through its writeback functionality.
Once a month, Leon Potthoff guides his loyal Power BI fans through the world of Power BI. And the community is growing steadily. The possibilities offered by Microsoft's analysis tool are diverse and, thanks to regular updates, constantly changing—but not always intuitive. That’s where Leon helps. With monthly focus topics, presentations of the most important updates, and an open discussion round, he helps diligent analysts optimize their work with data in Power BI.
Power Apps on the Power Platform
Power BI and Power Apps are tools within the Microsoft Power Platform. Alongside Power Automate, Power Virtual Agents, Power Pages, as well as data connectors, AI Builder, and Dataverse, they are essential tools for a targeted data stack. Power Apps is an app development platform that falls under the category of embedded applications; it is embedded into the canvas and filter context of a Power BI report page as an external program. The service is integrated into Microsoft 365.
Companies use Power Apps to develop low-code solutions for business challenges. Users can create custom applications without needing traditional development methods. It offers a drag-and-drop interface, allowing applications for web, mobile, and other platforms to be built quickly. Or, as Leon would say: “It just makes your life incredibly easy.”
Canvas Apps and Model-Driven Apps
Within Power Apps, a distinction is made between Canvas Apps and Model-Driven Apps. Canvas Apps focus on a custom user interface (UI). Users start with a blank canvas or an empty template and establish a connection to any data source. There is full flexibility in app design, both on the web and on mobile devices. Canvas Apps are free to use with standard connectors, provided at least one Microsoft E3 license is available.
Model-driven apps in Power Apps focus on the data structure and business logic derived from the underlying Dataverse. The data source must be based on Dataverse. Unlike Canvas Apps, users have limited flexibility in app design here. Model-driven apps can only be used on the web. They are fee-based and tied to Dataverse.
Connecting Power Apps with Power BI
Leon Potthoff puts all this theory into practice immediately. For those who missed the CoP session, we have summarized the most helpful facts here. Let’s jump into the Power BI service with Leon and look at an example Power BI report. The following will focus on employee management, which becomes much easier to organize using the writeback function via Power App.
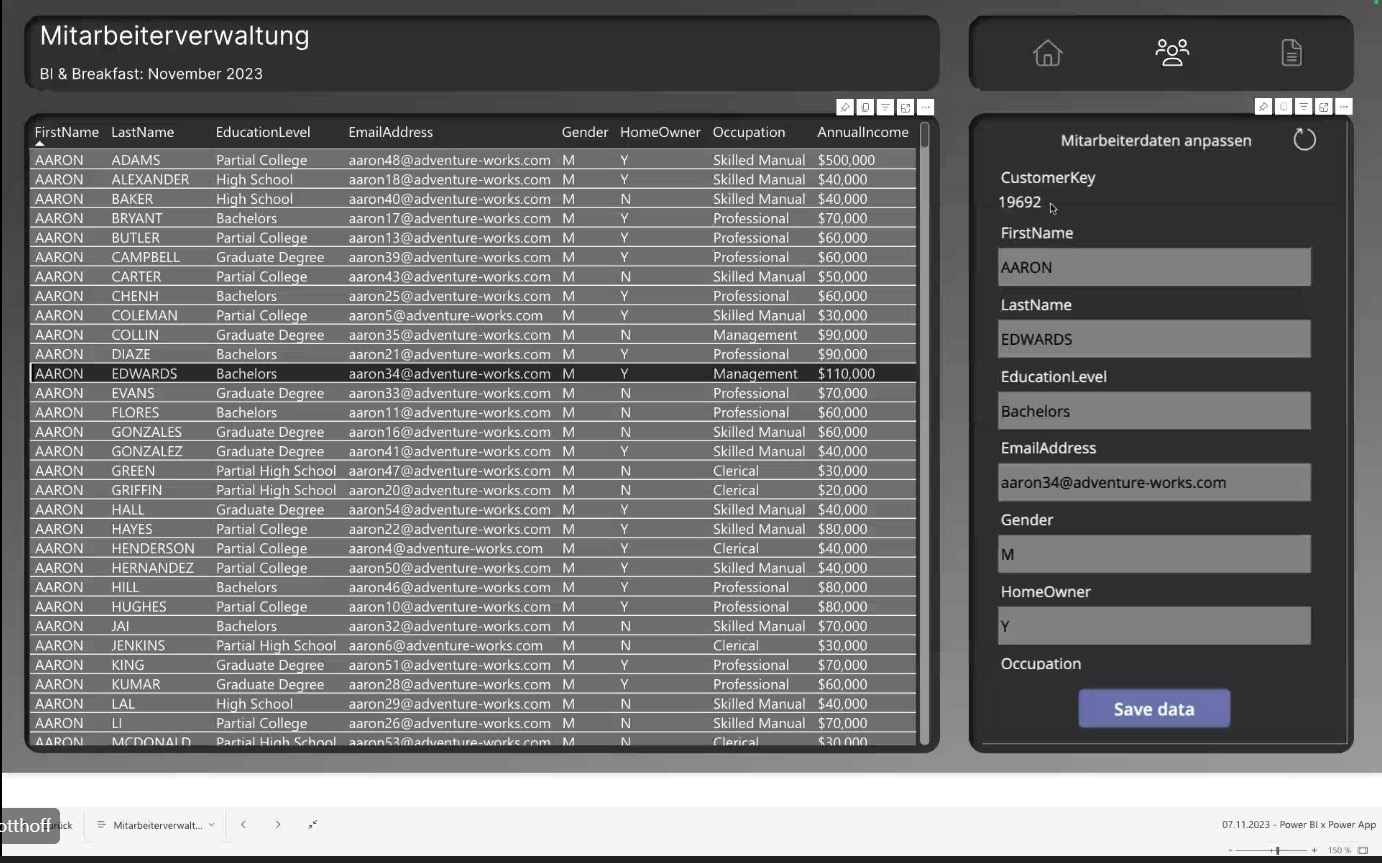
The table created in Power BI contains data that is partially incomplete or unmaintained. Long-suffering analysts will know the drill: to update the data, you usually have to leave Power BI to update the source table (e.g., Excel). This table must then be reloaded into Power BI to access the updated data. With Power Apps, this tedious process is a thing of the past.
Using the Power Apps field (visible on the right side of the screen in the screenshot above), Leon can change the dataset directly within Power BI in his example. To do this, he simply clicks the corresponding row in the table on the left, causing the complete dataset to appear in the Power Apps field on the right. In this field, Leon can manually change and save the data. The data is then not only updated in the Power BI report but is also updated and saved in the original data source—in this case, a PostgreSQL database. Depending on the process, data could even be maintained exclusively via Power Apps.
Datasets are changed directly in Power BI using Power Apps and written back to the database.
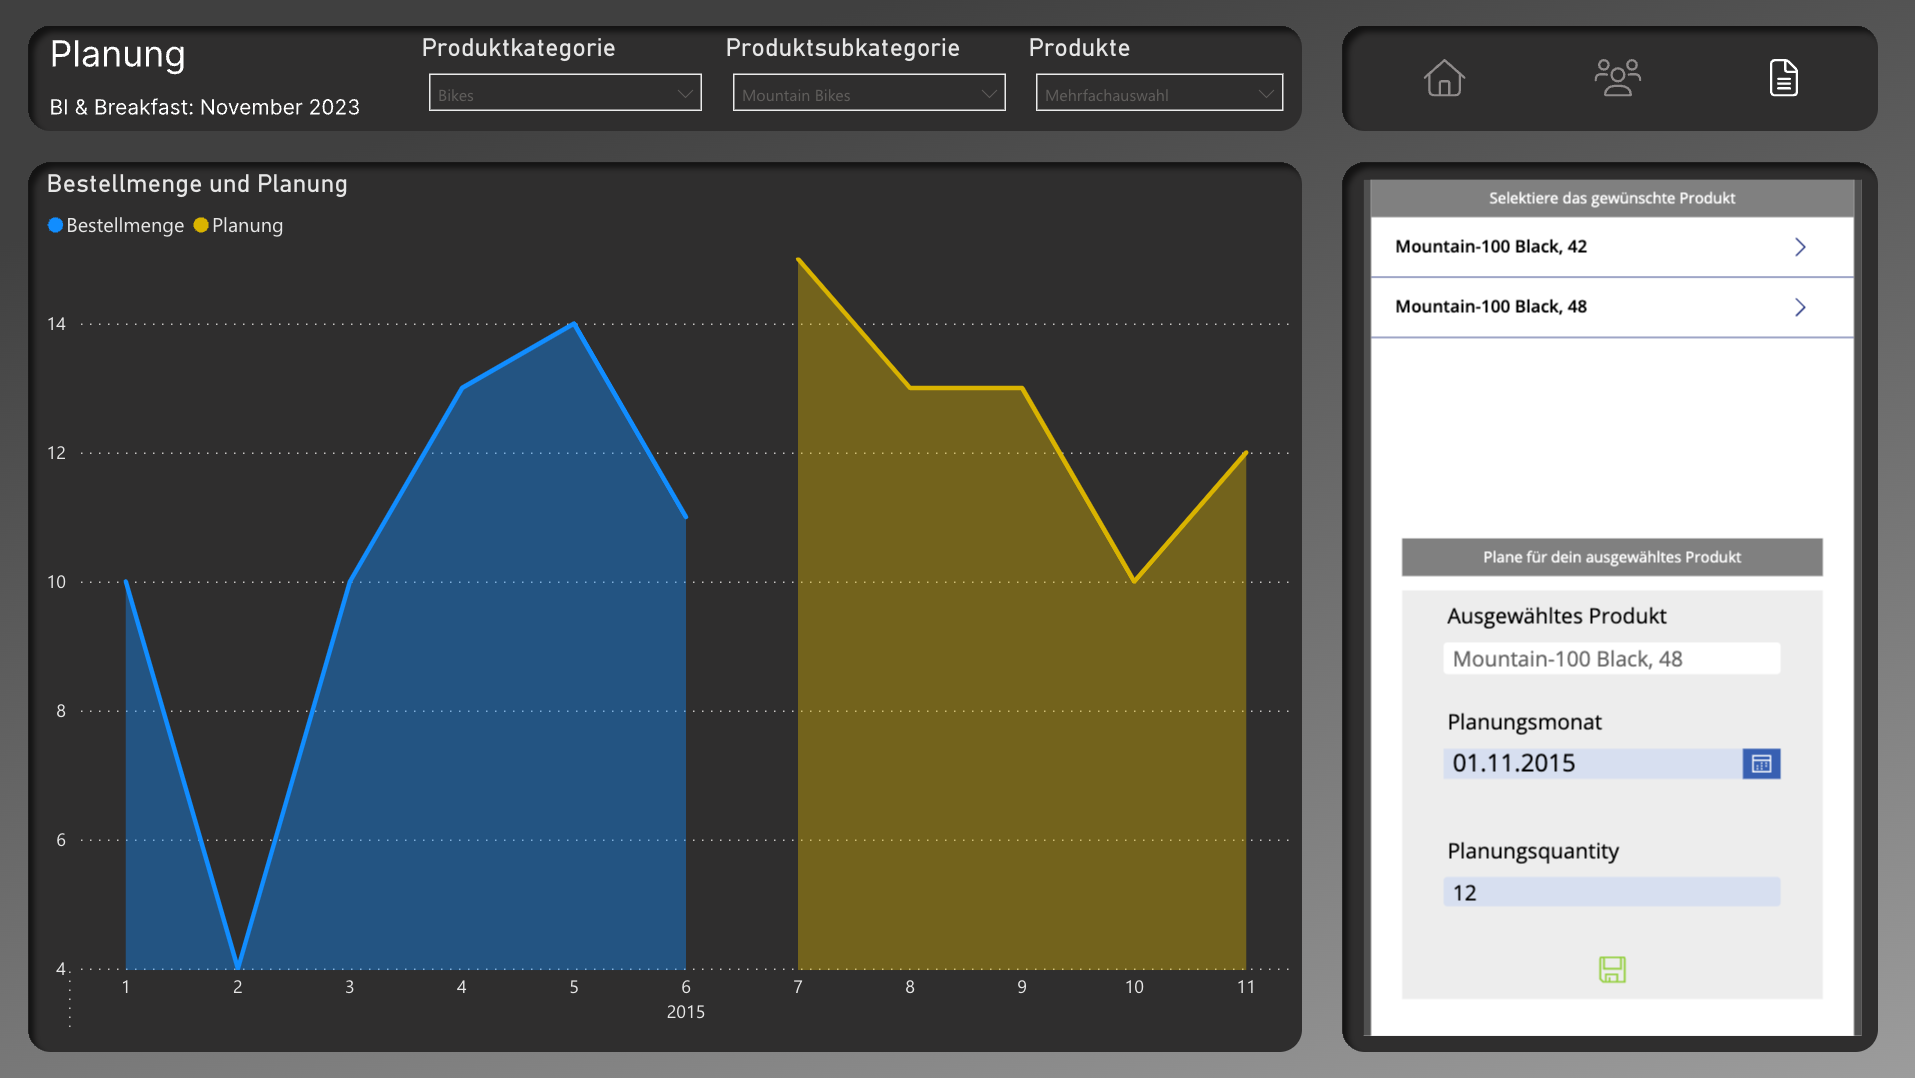
Comprehensive planning serves as another example. With Power Apps, it is possible to feed planning data directly into a report. The report then no longer just displays current inventory and the resulting forecasts, but also allows for a look into the future by incorporating individual parameters. Filters can be customized as needed.
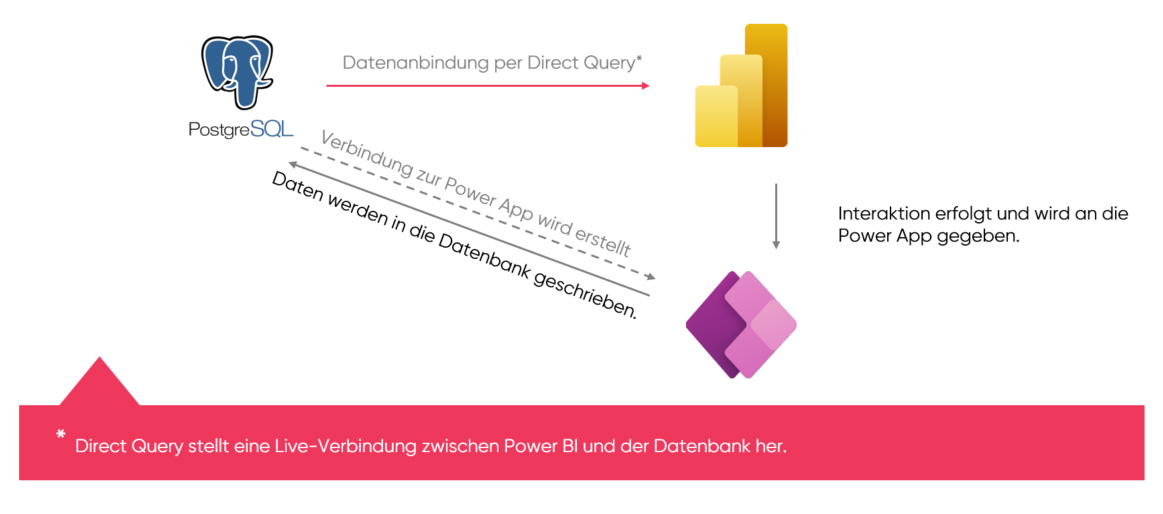
Power BI and Power App architecture
How do Power BI, Power Apps, and the database work together? In Leon's example, the data is stored in a Postgres database and connected via Direct Query. Direct Query establishes a live connection between Power BI and the database. If something changes in the database, a simple click on the visualization is enough to update and display the data directly within the visual.
Once the data is connected, the next step is to create a Power App in the Power App Center. After that, the Power App is connected to the Postgres database. The Power App is then deployed in Power BI, where it can immediately interact with visualized data and, conversely, write modified data directly back into the database.
Creating a Power App in Power BI
How is a Power App created in Power BI? Once the data is connected to Power BI, the relevant data sets can be selected in the table. At this point, you can begin designing a Power App. The "Power Apps" visualization is available by default in the "Visualizations" pane. A window will open with a brief tutorial.
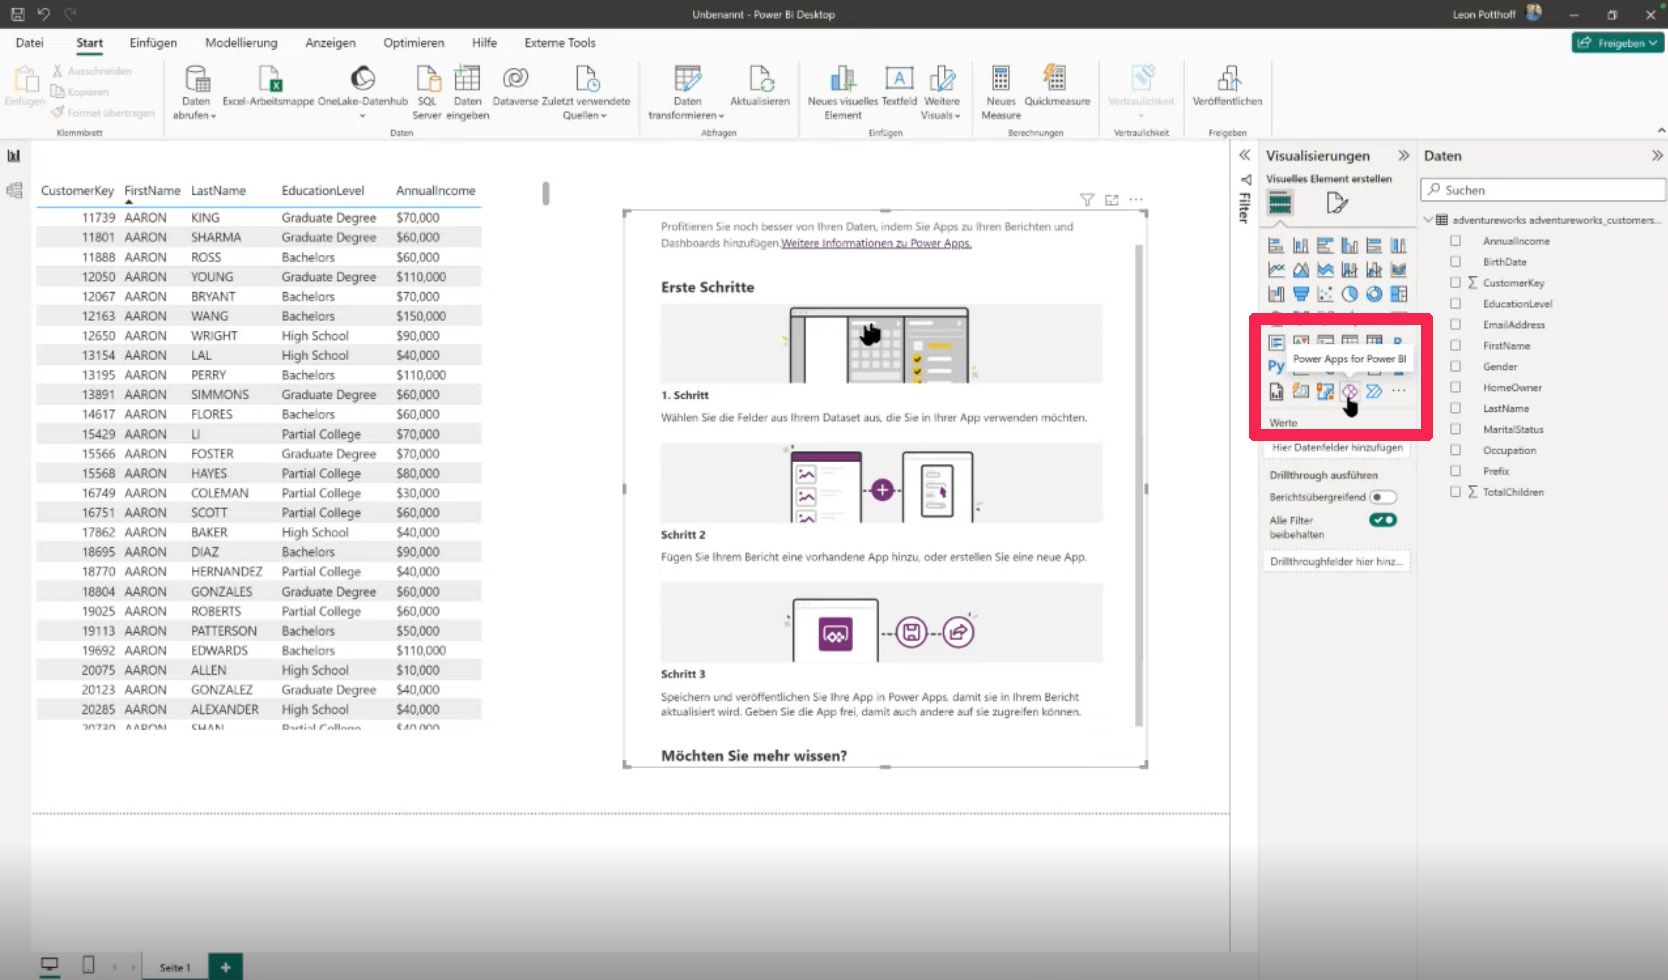
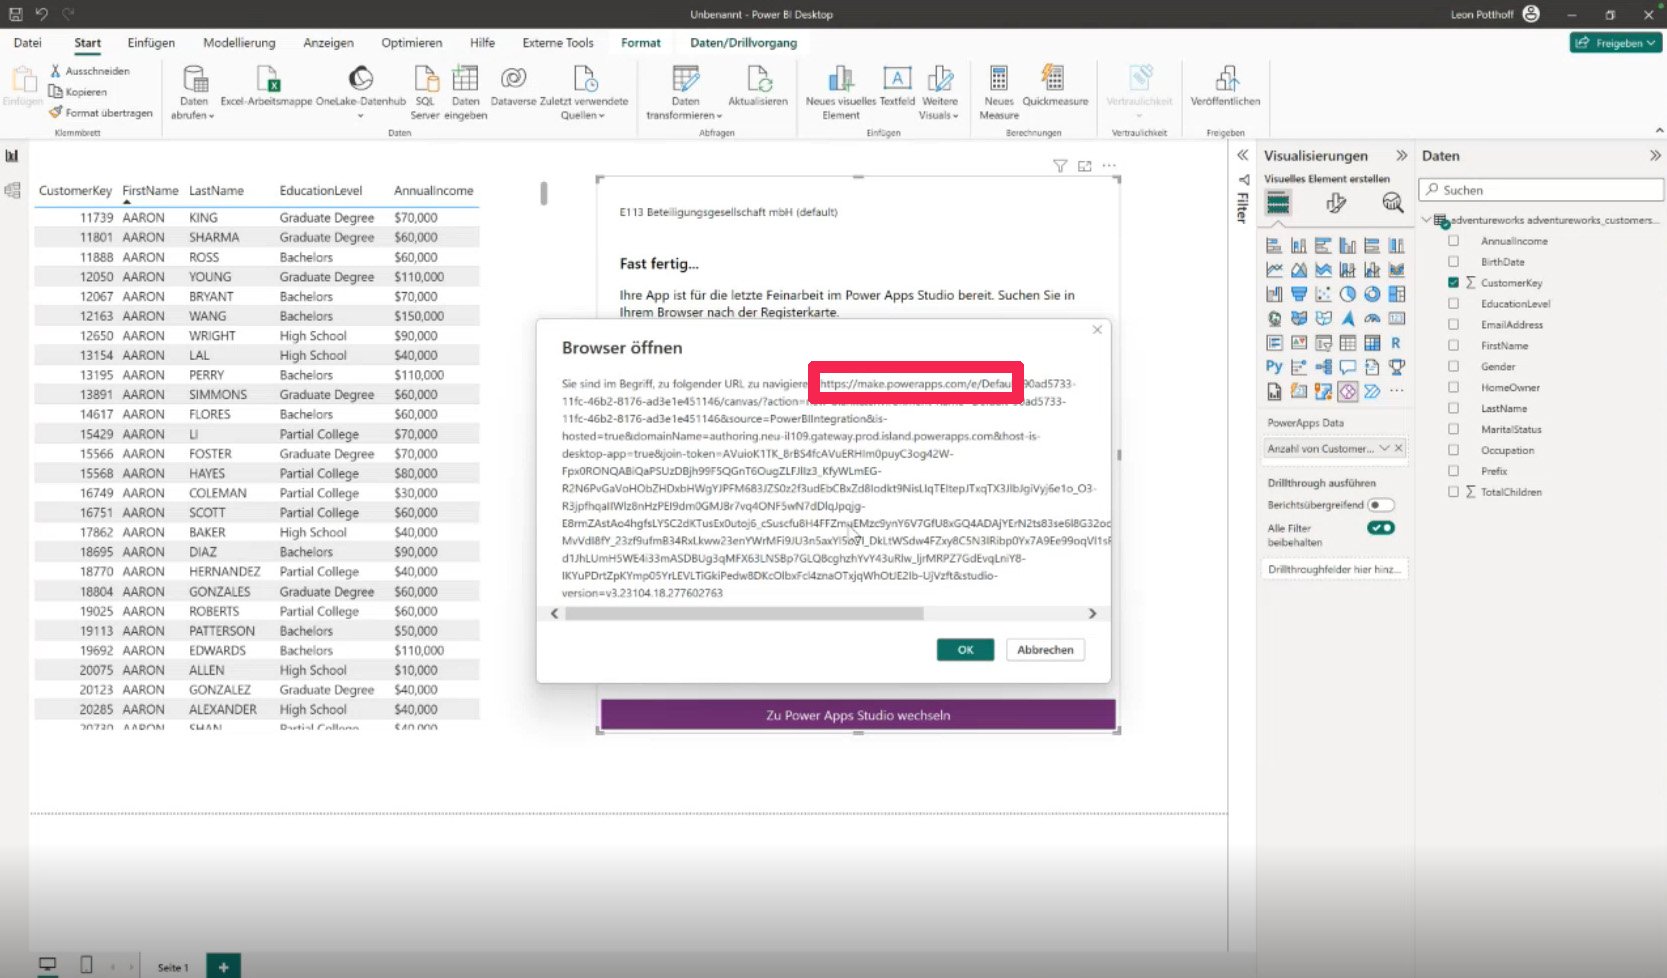
Here, we select the fields to be used for the visualization. Then, we add an existing app to the report or create a new one. Once published, it can be used in the report and is continuously updated.
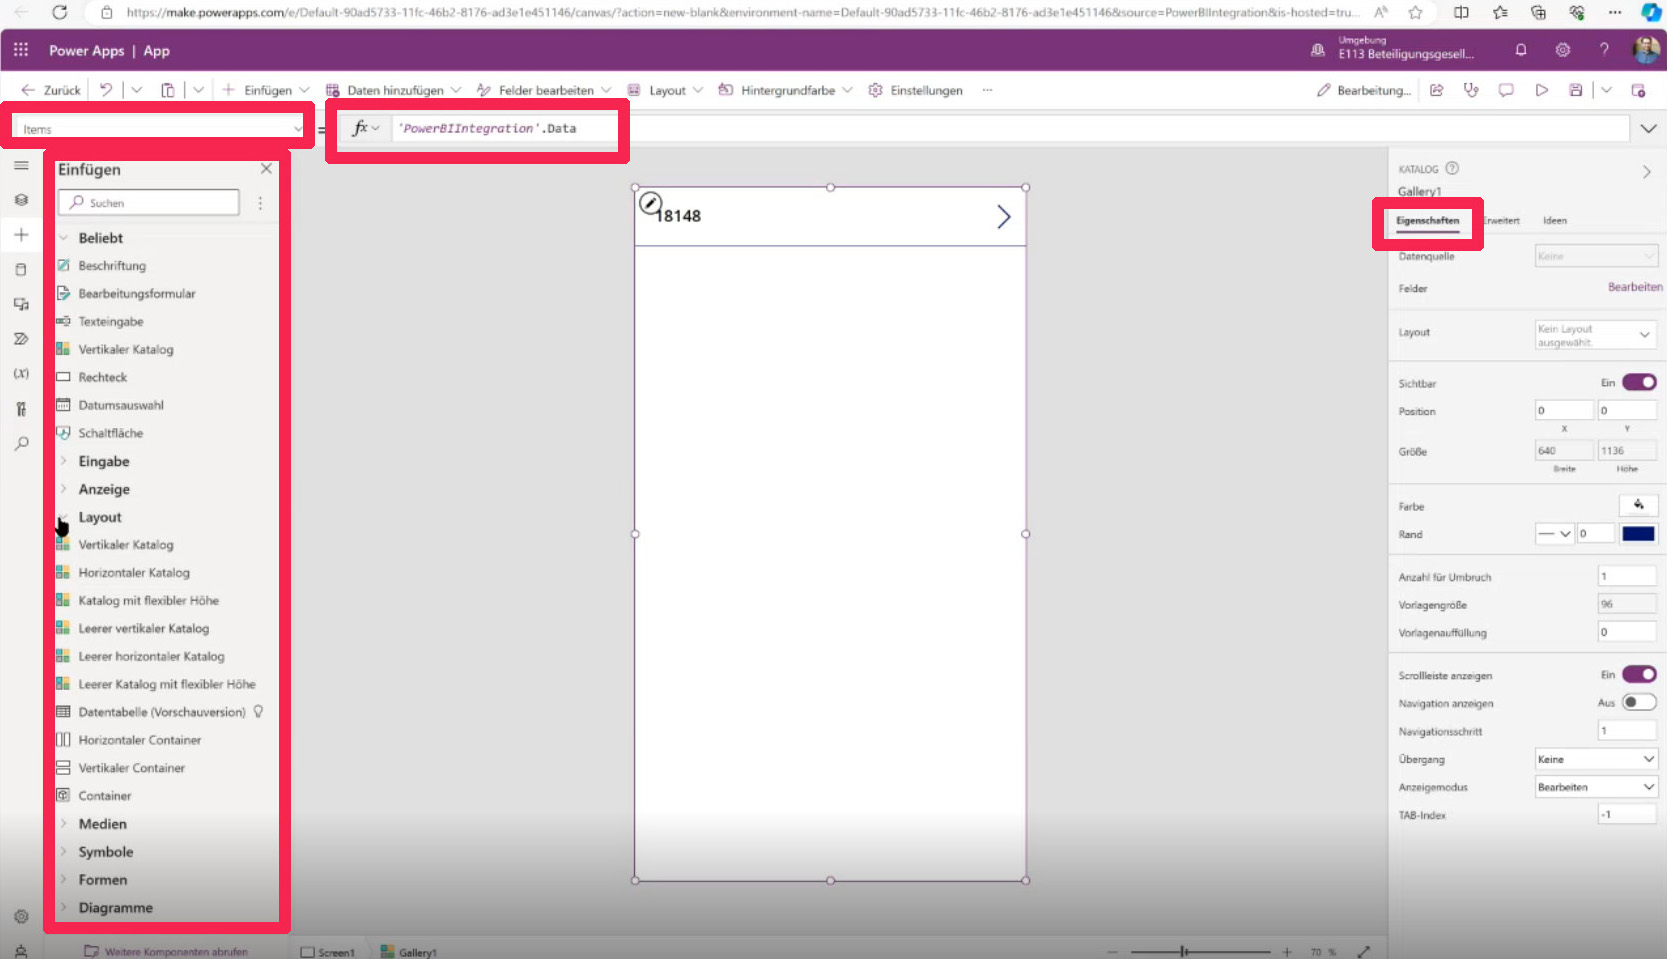
If we create a new app, we are redirected to the Power App Center via the URL make.powerapps.com. The Power Apps interface then opens. The navigation is modeled after familiar Microsoft products. For selected elements, various properties can be set using a drop-down menu in the top left. The "fx" bar at the top of the screen allows for the use of the low-code language Power Fx, which can be used to customize individual functions. On the left side is the tree view, where various elements such as inputs, displays, layouts, or shapes can be added. Also on the left, you can connect a wide variety of data sources via the "Data" field. To change the view or layout of the app, we use the "Properties" columns on the right.
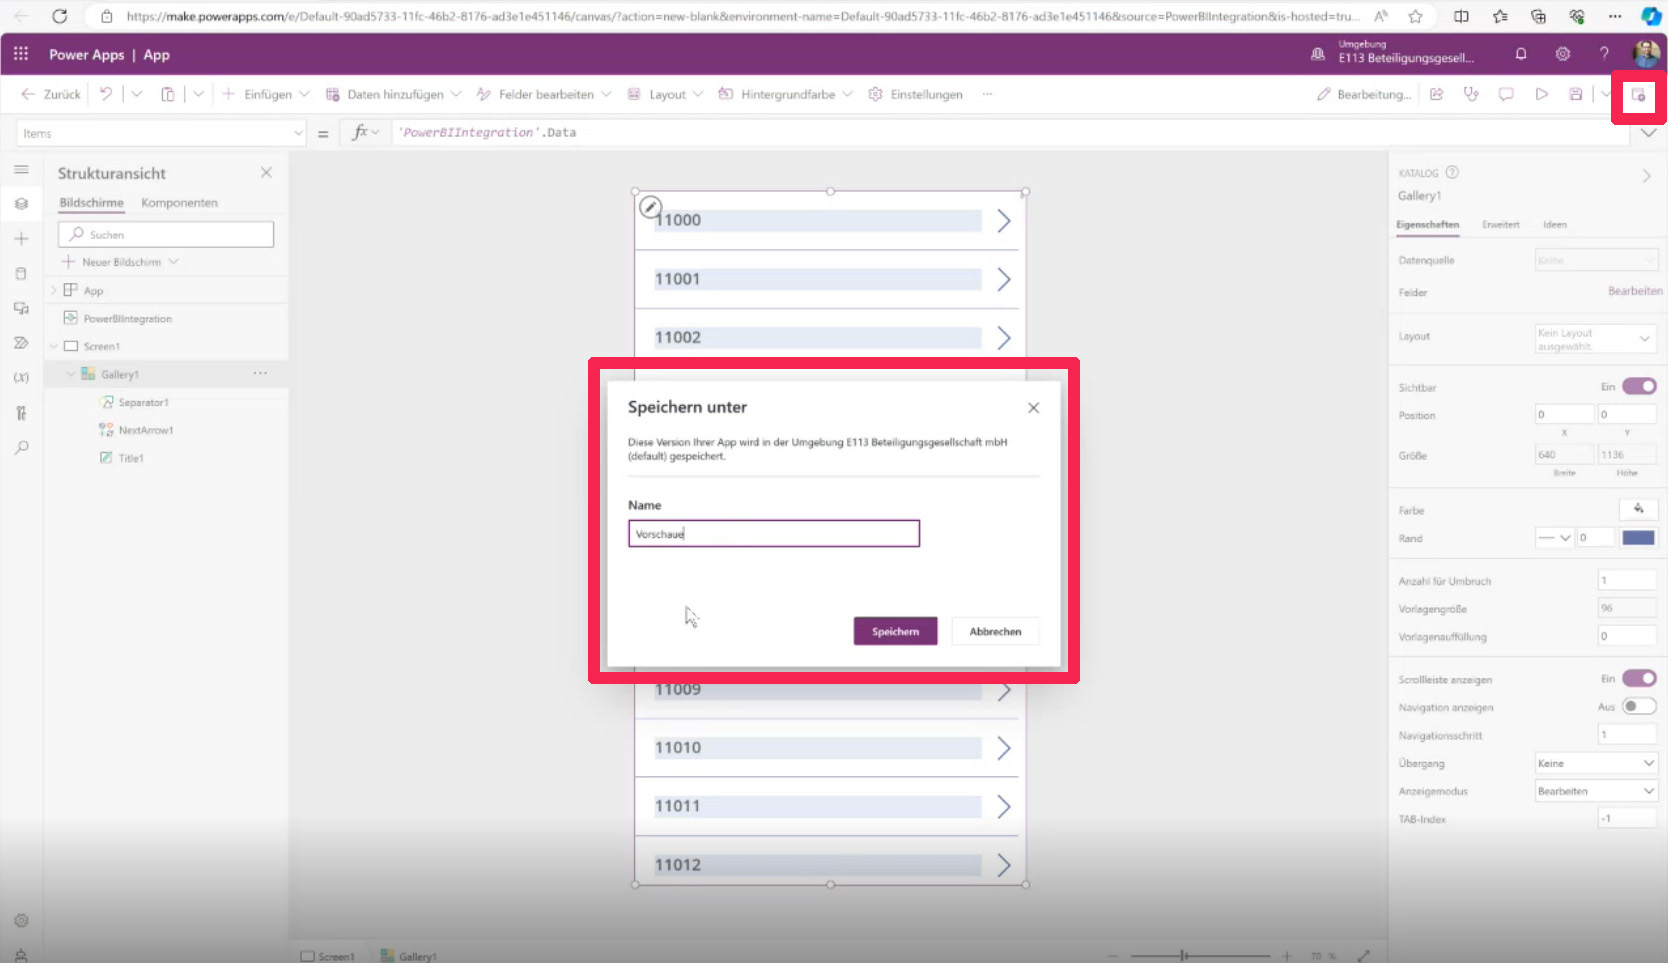
Once all parameters are set as desired, we save the app to publish it in Power BI. This is done using the icon at the far right of the top menu bar, which shows a small upward-pointing arrow. We give our app a name and save it.
If we switch back to Power BI now, we can see that the items selected in Power BI are displayed directly in the app.
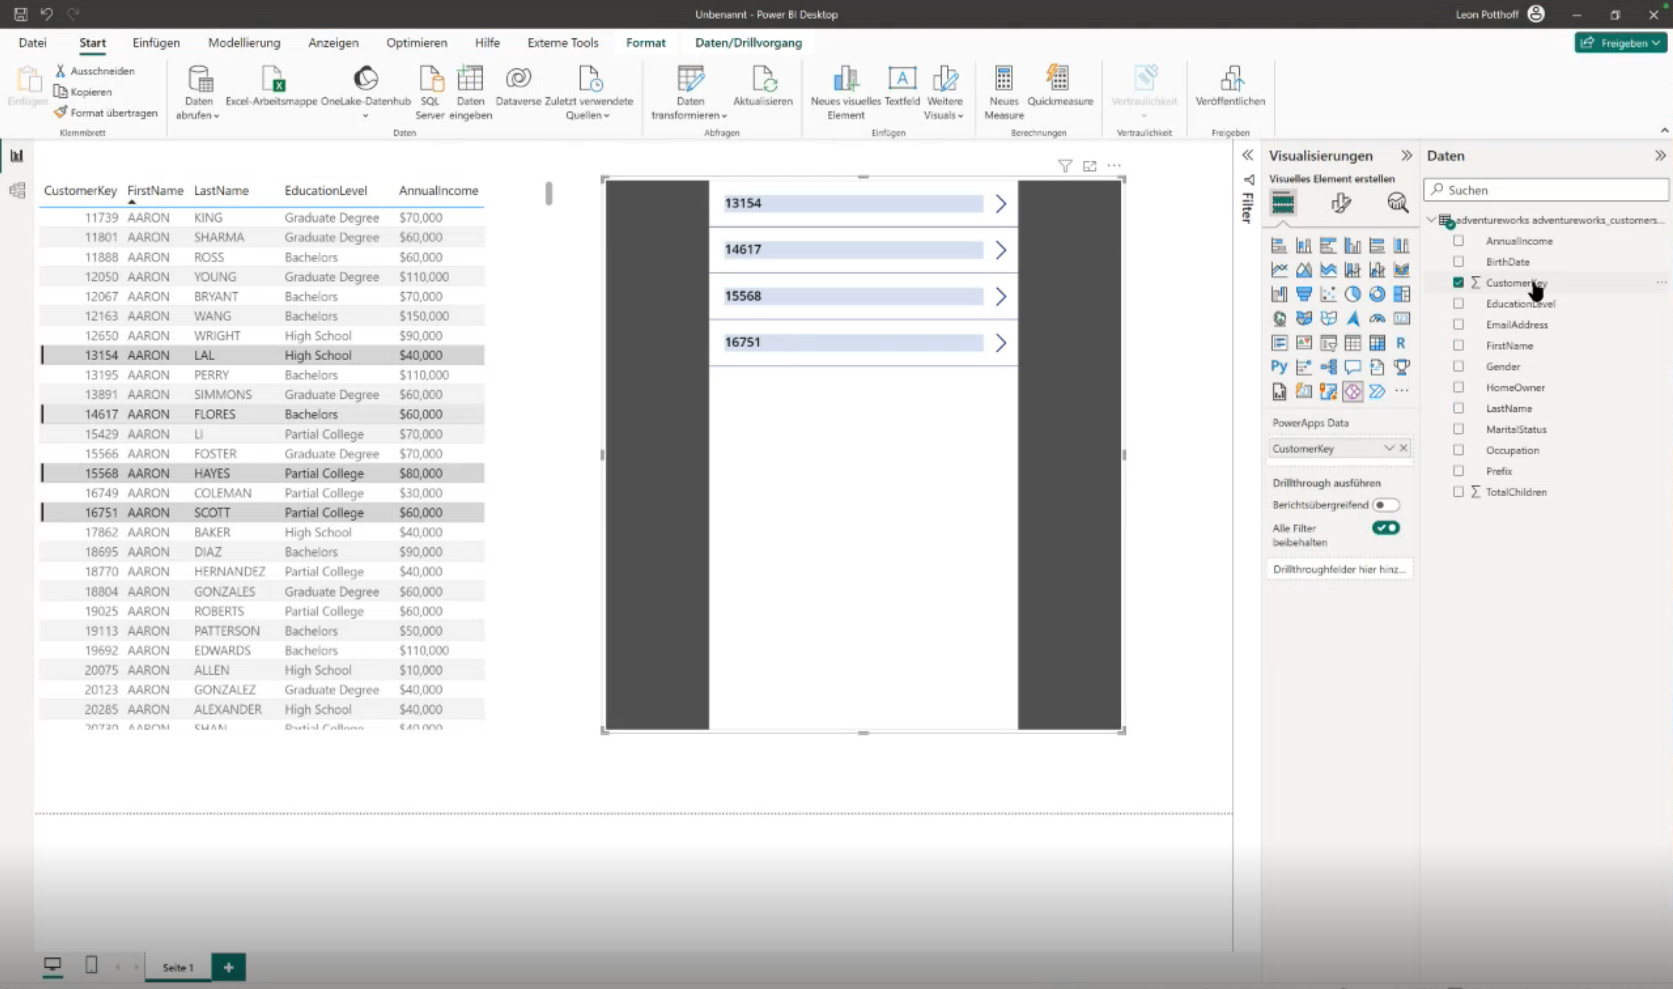
Done! You can edit the desired records in both Power BI and Power Apps. All changes are captured and saved across all levels.
The Power Apps visual is available in Power BI by default and responds to interactions within the Power BI report. If it is not visible, this can usually be resolved via the administrative settings. Power Apps can sometimes be used free of charge with E3 licenses. There are certain limitations; for example, only 1,000 rows can be loaded into the Power BI report using the Power App. Therefore, the benefits of Power Apps should always be evaluated on a case-by-case basis.
BI & Breakfast in December
In the next Community of Practice, Leon will talk about versioning options for Power BI reports and cover the topic of calculation groups. Custom map visuals will also be discussed. If you're eager to learn more about Power BI, be sure to join us on December 6th at 10 a.m. for another session of BI & Breakfast with Leon Potthoff. See you in four weeks!
Sign up for BI & Breakfast Power BI now!